Please don't forget to read Usage part of each element.
Donut graph
Donut graph is a circular visualization displaying data proportions, showing the part-to-whole relationship of one value compared to its total.
Overview
Donut graph is a part-to-whole data visualization showing relationship of one value compared to its total.
The donut graph starts at 12 o'clock and moves clockwise. When a value is expressing the amount used out of a total, the donut graph will start empty and fill in clockwise.
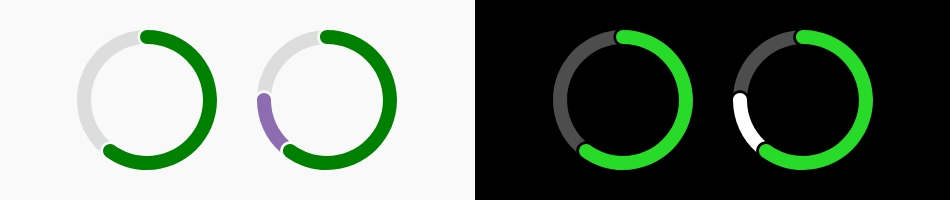
You can use the donut graph in both dark and light theme.
Statuses
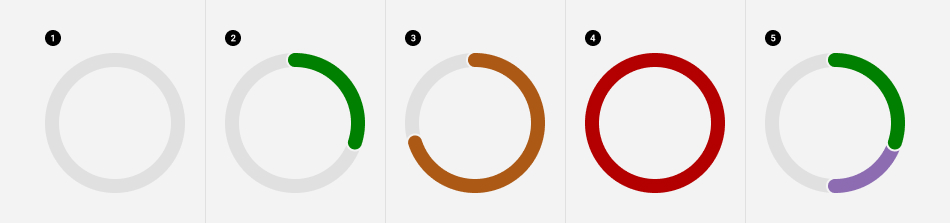
When you use the donut to show consumption (of datas, minutes, etc.), 3 statuses are available for the usage bar:
-
No usage
The customers' usage is not yet started. -
On going usage
The customers' have already consumed some of their content... -
Approaching the full usage
The customers' usage has reached 80%. -
Exceeding usage
The customers' usage has reached or exceeded 100%. -
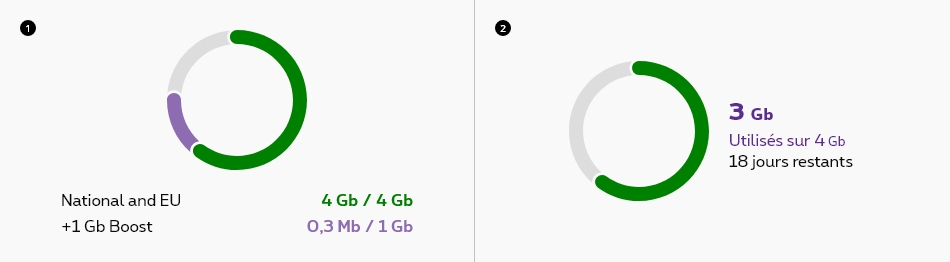
Additional data
Two kinds of data used/remaining out of a total. The second kind of data appears when the first one is completely used.
If the customer's plan is unlimited, keep the usage bar colour green all along.
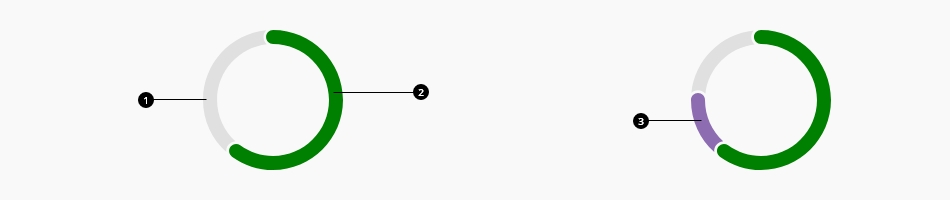
Anatomy
-
Donut bar
-
Usage bar
-
Additional data bar
Legends
Position the legends at the bottom of a donut graph by default. Depending on the page’s layout and context, you may choose to position the legends at the right of a donut graph.
-
Bottom
Default position. -
Right
Sizes and colors
The keys data and dataMax are mandatory inside the razor code. The unit measure is Gb.
The key donutId is mandatory inside the razor code for accessibility of donut's label.
Donut graph is a webcomponent which needs data-rslib-webcomponent-load="rslib.apps.donutgraph" attribute to work and data-invoke="Donut.init" on the donut div.
Default donut
Depending on the progress of user's data, donut has differents status:
- 0 - 80% of usage: data are green.
- 80 - 100% of usage: data are orange.
- +100% of usage: data are red.
Donut are available on positive white and grey2. If the background isn't white you must put grey2 to a key named bgColor .
Donut with boost
The keys dataBoost and dataBoostMax are mandatory inside the razor code. The unit measure is Gb.
Donut with more labels
Free low speed
Add freeLowSpeed to the razor code. The unit measure is Gb.
Data for pickx app
Add pickx and pickxMax to the razor code. The unit measure is Gb.
Label on right
Add labelOnRight = true with dayNumberLeft to the razor code.
Donut for unlimited plan
The difference between limited and unlimited plan is the color of the donut. It stays always green in unlimited. To have unlimited donut put unlimited = true in the razor code.
Negative donut
Negative donuts are available only on a black background. You must put isNeg = true and set the bgColor on black.
JavaScript
As Donut graph is a webcomponent, you will have to load
CONTEXT refers to document or html element parent.
If the scroll of your page isn't the body, put data-scrollparent=""
attribute to the donut div with the class of the scrollparent. For example, if it's inside an overlayer, put data-scrollparent=".reveal-modal".